GICA Forecasting System

GICA Forecast System provides a platform for quantity forecasting. It is Cloud Based.
What is Gica Forecast System for?
1) It is based on historical data to forecast future data.
2) A typical situation is based on previous 24 months/days data to forecast next 12 months/days data.
How Gica Forecast System works?
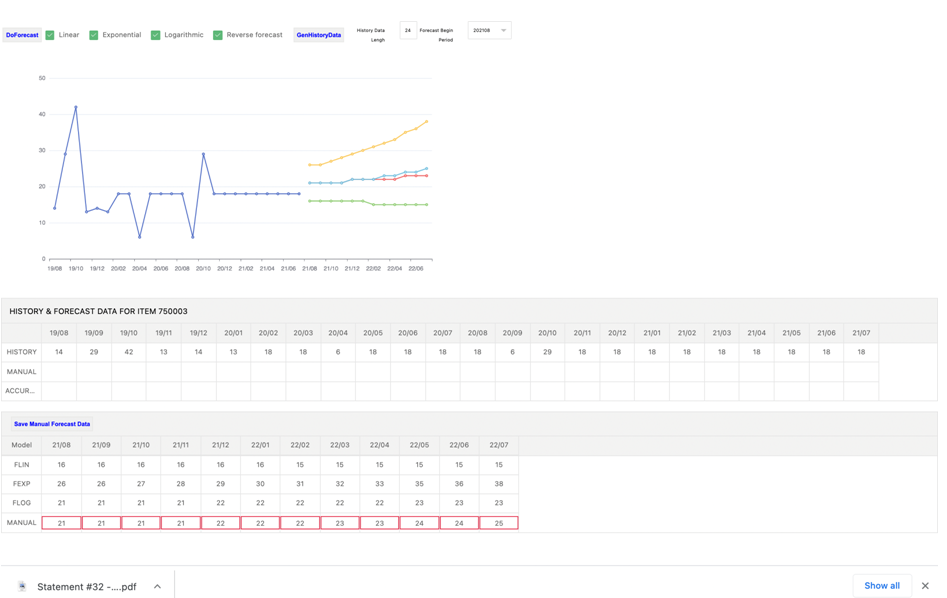
1) The forecast is based on three algorithms.
2) This can be extended to more algorithms based on particular industry specialties.
3) The average value is displayed on the MANUAL row, as a reference.
4) You may adjust these forecasted data based on your professional opinions and other information that system has not considered, for example weather suddenly changed.
5) Then save the forest + manual adjusted data into system, which is the Purchase Plan for next 12 months.
How Gica Forecast System performs self-learning?
1) When Gica Forecast System generates data, user can manually adjust this set of data. System will automatically remember the gap between system generated data and the manually adjusted data. This will be used as a self-learning factor. Then such difference accumulates every time when you perform Forecasting, it provides a self-learning environment to improve forecast algorithm automatically.
What is Reverse Forecast in Gica Forecast System?
1) Reverse Forecast is a function allows you to choose a back date to do forecasting. For example, today is 2021/07, you can choose 2020/07 to do a 12 months’ reverse forecasting, to use the system forecast the data for the previous 12 months.
2) Such reverse forecasting data is saved and recorded, being used for comparison with the Actual sales data in the same period. Therefore, system records down the gap of these two data sets.
3) This function provides a mechanism to evaluate the accuracy of Gica Forecasting algorithms.
4) Such accuracy data is also used by system as self-learning engine, in order to improve the algorithm automatically.
What are the main Function and feature?
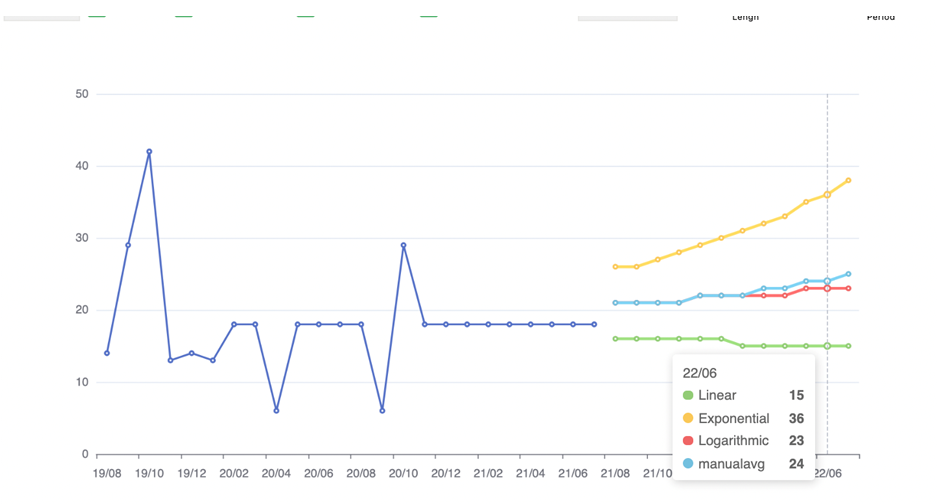
1) History Data and forecasting data are displayed in graph

2) The average data of 3 algorithms are also displayed on graph.
3) History data, Manual data and forecast accuracy are all displayed for reference and comparison.

4) The forecast data of three forecast algorithms are displayed, then the average data of the three algorithms.

5) User can manually adjust the average data in MANUAL column then save the result as Purchase Plan.
6) Easy operation screen provides more information about the SKUs’